
Long Beach residents interested in detailed crime statistics now have a new resource to find the latest trends and data.
A crime dashboard launched this week by the Long Beach Police Department will help residents access timely and accurate crime statistics citywide, the department said in a statement.
It’s searchable and sortable, including by date, type of crime and geographic area.
All the data it uses is updated daily, but there is a 21-day delay “to account for potential delays in processing crime reports,” according to the LBPD.
It will replace the monthly crime statistics PDFs that the department published on its website. With the launch, the department included a video tutorial on how to navigate and sort the crime statistics.
“This is a way to share information that we’ve historically had difficulty in sharing because of the technology that was available to us,” Chief Wally Hebeish told ABC7.
The dashboard has four main sections: City Overview, Crime Trends, Beat Explorer and Extract Page.
- The City Overview page has a summary of crime trends in a given date range, which users can filter. With it, users can view all crime categories citywide or filter by police division and/or type of offense committed, such as murder, arson, motor vehicle theft and drug/narcotic violations.
- The Crime Trends page features various charts showing how the reported offense has changed month-to-month, stats for each division or beat and the frequency of the crime by day of the week and time of day. On this page, users can also sort by division, date range and offense to change the results shown on the charts.
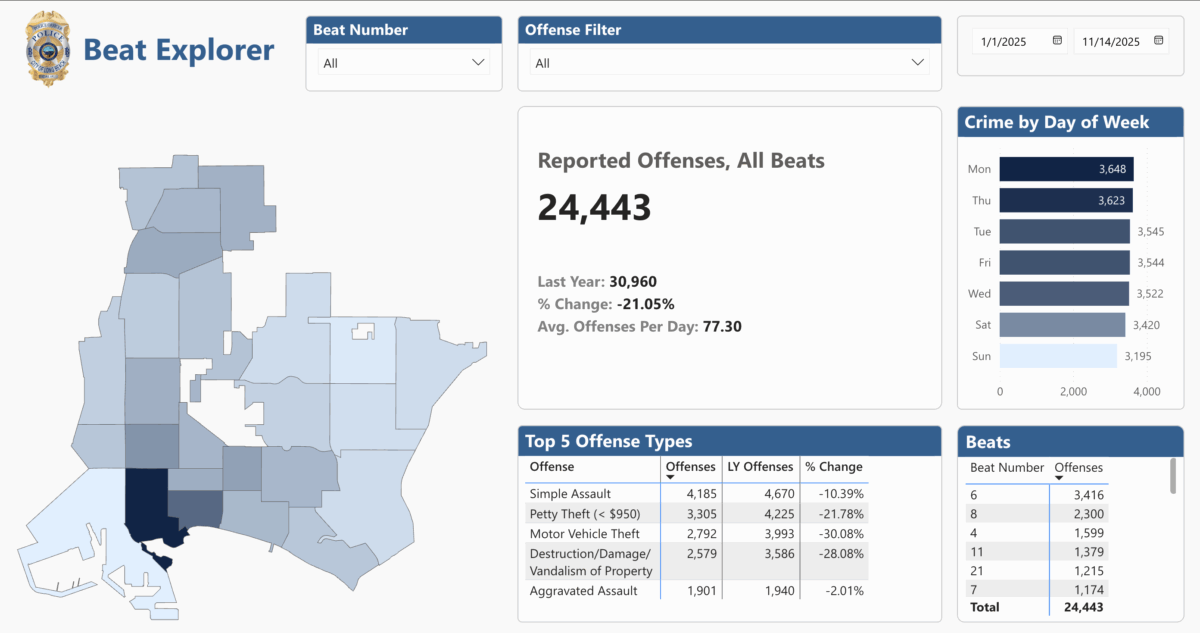
- Once a user enters their address to see what beat they’re in, the Beat Explorer page gives users a breakdown of the selected offense(s) within their specific police beat. The page also features a map showing the frequency of a given crime across different police beats in the city.
- The Extract page allows users to download data into an Excel spreadsheet or comma-separated values format.
Users can submit questions or feedback on the dashboard here.