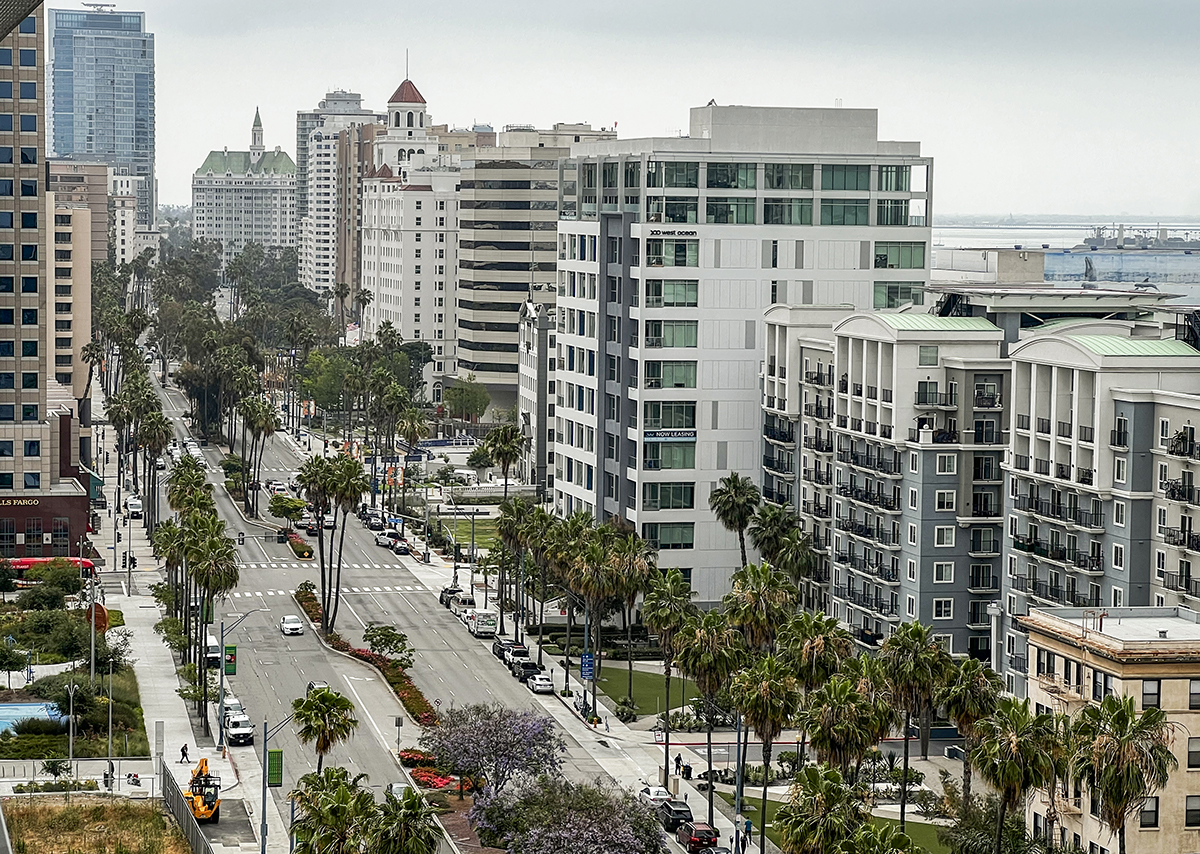
Downtown Long Beach’s business improvement association has launched a new dashboard with monthly data on trends in the retail, office and residential real estate markets.
The dashboard, managed by the Downtown Long Beach Alliance’s Economic Development Department, includes a variety of metrics that the organization believes will prove useful for real estate developers and local businesses.
Previously, the DTLB Alliance compiled quarterly market reports, with each quarter covering one market sector — such as retail or office space. The dashboard provides monthly updates on each sector.
It was launched with the hope that “allowing our stakeholders and potential investors to interact and export specific market trends will minimize vacancies and catalyze attraction efforts,” Stephanie El Tawil, Economic Development & Policy Manager, said in a statement.
One tab includes a map of all development projects currently planned or recently completed in Downtown Long Beach.
The “Residential” tab includes data on the average rent charged in Downtown Long Beach — broken down by dollars per square foot — as well as changes in occupancy percentages over the past five years.
It shows that in 2019, the average cost of a one-bedroom apartment in Downtown Long Beach was $2.54 per square foot. This year, it’s $3.32 per square foot.
That increase puts downtown Long Beach on par with rent in Costa Mesa ($3.12) and Downtown Los Angeles ($3.29), but pricier than the rest of Long Beach ($2.66), San Pedro ($2.62) and Santa Ana ($2.96).
Office vacancies have risen significantly in that same time frame — from 18% in 2019 to 31.6% this year — while retail spaces have also seen a dip in occupancy. In 2019, roughly 93% of retail space was rented in Downtown Long Beach. This year, that number is 86.1%.
“Staying on top of DTLB data in real time allows us to respond to inquiries, highlight assets, and create opportunities to promote DTLB to investors, businesses, residents, and visitors,” El Tawil said in a statement.

