

Long Beach on Friday launched a new data page that will include updated breakdowns of how many COVID-19 vaccines shots have been administered along with demographic details.
The information is now available on the city’s interactive COVID-19 data dashboard, which features timely updates on COVID deaths, hospitalizations and case rates, officials said. As of Friday, more than 104,000 vaccine doses have been administered in Long Beach, which is one of just four cities in California with its own health department.
Long Beach Mayor Robert Garcia in a statement on Friday lauded the city’s efforts, noting that more than half of all older residents in Long Beach have had at least one shot.
“I’m incredibly happy and proud that 60% of our 65+ seniors have been vaccinated,” Garcia said. “As we continue to vaccinate as many people as possible, it is critical that we make data accessible and open to the public.”
The information will include the total number of vaccine doses allocated to the city as well as the number of administered first and second doses. The data will also show demographic information for vaccinated residents including age, gender, ethnicity/race and ZIP code.
Among the highlights:
- About 14.5% of Long Beach’s population (66,553 residents) have received at least one dose, which is higher than the 12% in Los Angeles County and 8.2% in Orange County.
- About 60% of the Long Beach residents 65 and older have been vaccinated either in Long Beach or another jurisdiction, which is higher than 43% in Los Angeles County and 52.6% in Orange County.
The numbers also show stark disparities in vaccine rates by race and ZIP code. For example, White residents make up 28% of the total population but account for 39% of vaccinations. In contrast, Latino residents account for 42% of the population but just 20% of vaccine doses.
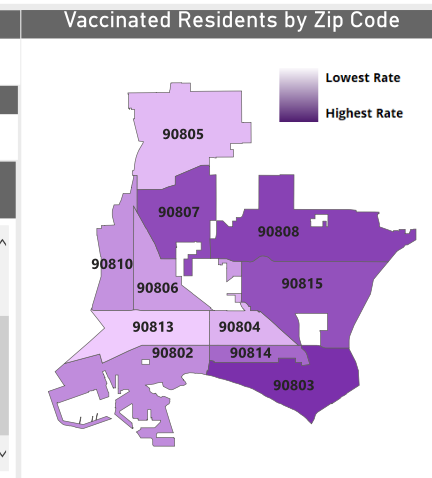
ZIP codes on the east part of the city account for the highest vaccine rates though they have the lowest rates of cases, deaths and hospitalizations. The 90803 ZIP code, which includes Belmont Shore, has the highest vaccine rate with 24% of the population vaccinated, but it also has the lowest COVID death rate, with a rate of 28 deaths per 100,000 residents as of Feb. 4, according to data provided by the city. The numbers do not include long-term care facilities.
The 90813 ZIP code in dense Central Long Beach has the lowest vaccine rate at just 7.9%, but it has city’s second highest death rate with 113.1 deaths per 100,000 resents.
Health officials have noted that the number of White residents vaccinated corresponds with census data showing that Long Beach’s older adult population is 54% white, and the majority of those residents live in the east part of the city.
Nonetheless, officials have said there is more work to be done to address the disparities, and the city in recent weeks has held five pop-up clinics in North, West and Central Long Beach to bring the vaccine to hard-hit areas. Additional clinics will be planned in March.
The city this week received 5,100 first doses that were scheduled with a focus on those who have registered in ZIP codes with high COVID-19 case rates and lower vaccination rates, officials said.
The vaccine information will be updated regularly Monday through Friday when new information becomes available.
“We have worked diligently to ensure these data are presented in a timely, accurate and consistent manner that can be easily understood by the public,” Health Department Director Kelly Colopy said in a statement. “We will continue to provide more vaccination data as they become available.”
As of Thursday, the city has recorded a total of 51,195 COVID-19 cases and 832 deaths.